In order to predict future market moves technical analysts often look back at previous patterns. The crypto bear market of 2014 and 2015 has often been used as a comparison and repeating chart patterns known has fractals may give us an indication of where Bitcoin prices will go next.
On-chain Capital Flows Bullish
Analysts don’t always use price charts to predict market movements. Bitcoin network momentum has also been used as if provides a good visualization of on-chain capital flows. Crypto trader Josh Rager has taken one of Willy Woo’s BTC network momentum charts and pointed out the fractal patterns. Fractals, which is when a pattern repeats itself on a smaller scale, can be seen in all forms of nature and are repeated in financial markets.
“This BTC fractal shows unbelievably similar patterns. The chart visualizes the BTC capital flows passing on-chain (i.e. investment activity). Estimates are from @coinmetrics’ new Data Pro product. One would have to flip bullish 100% if the momentum continues,”
This BTC fractal shows unbelievably similar patterns (chart via @woonomic)
The chart visualizes the BTC capital flows passing on-chain (i.e. investment activity). Estimates are from @coinmetrics‘ new Data Pro product
One would have to flip bullish 100% if the momentum continues pic.twitter.com/TZTTm4twDo
— Josh Rager 📈 (@Josh_Rager) May 5, 2019
A very similar pattern has repeated itself in the current market indicating that network activity is ramping up. Woo added that “On-chain is used to see the macro structure of the market, framing the context of your trading (trend is your friend, when can we expect trend next reversal?).”
The debate continues as to whether Bitcoin will drop back below $4,000 again but the longer it stays at current levels, and continues to move higher, the less likely it is to drop. Bitcoin has currently been in its longest uptrend, around three months, since the bear market began in early 2018. The signals are now a lot more positive and analysts have started to flip to bullish even in the short term.
Murad Mahmudov, who has charted longer term movements for Bitcoin, has also joined the bulls with a recent tweet stating that “My list of 20 reasons why I think that if 5450-5550 area holds – its very bullish & megamoonsoon is still on the table: I repeat, IF, 5450-5550 area holds, THEN, it’s quite bullish.”
BTC Holding Steady Over The Weekend
Bitcoin made a big move late Friday to push past resistance at $5,600 and hit a new 2019 high of $5,870 on Saturday. There has been a little pull back over the past 24 hours but BTC has held most of those gains and is trading at $5,700 at the time of writing, still above the 50 week moving average.
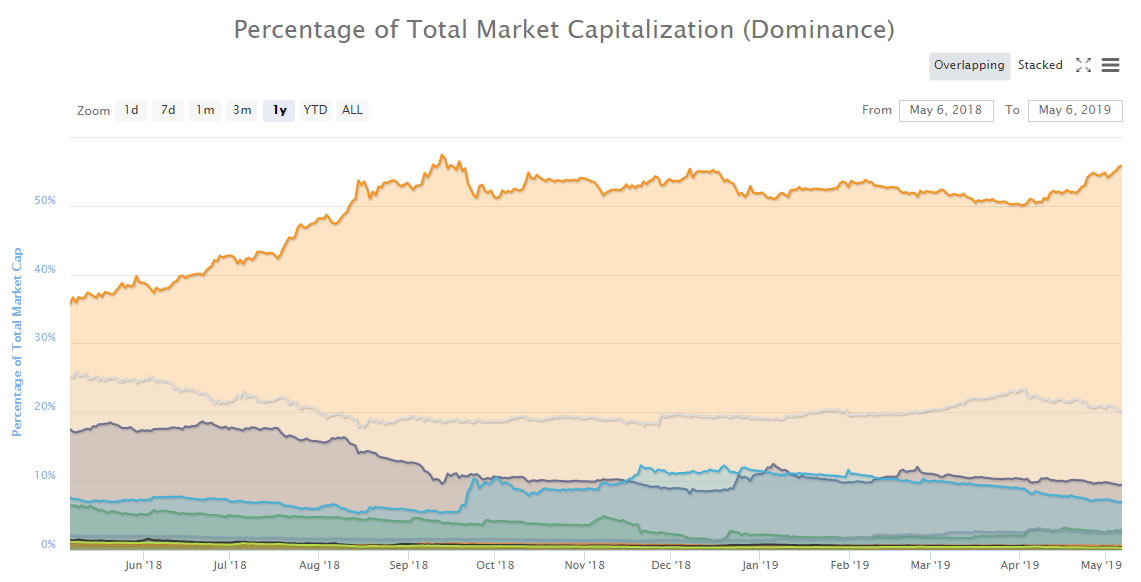
BTC market dominance 1 year. Coinmarketcap.com
The altcoins have been eaten as BTC dominance has also hit a new seven month high of just below 56 percent. The last time BTC had such a large share of the crypto market was in September 2018. Crypto market capitalization also hit a new 2019 high over the weekend of $188 billion though 30 percent of the total volume was Bitcoin alone.
Image from Shutterstock
Source: Crypto New Media


