 View
View
- Bitcoin’s dominance rate has hit 8-month highs, suggesting investor confidence in the recent price rally.
- A test of highs above $6,500 seen in November last year now seems likely.
- Such a move, however, may be preceded by a pullback to the 10-day moving average at $5,633 if the immediate resistance zone of $6,055–$6,100 remains intact in the next 24 hours or so.
- The short-term bullish outlook would be invalidated only by a drop below the 30-day MA at $5,365.
Bitcoin’s (BTC) recent rally looks sustainable, according to the charts, and the cryptocurrency’s rising dominance rate suggests investors are bullish.
The price of a single bitcoin jumped to $6,099 earlier today, the highest level since November 14, according to Bitstamp data.
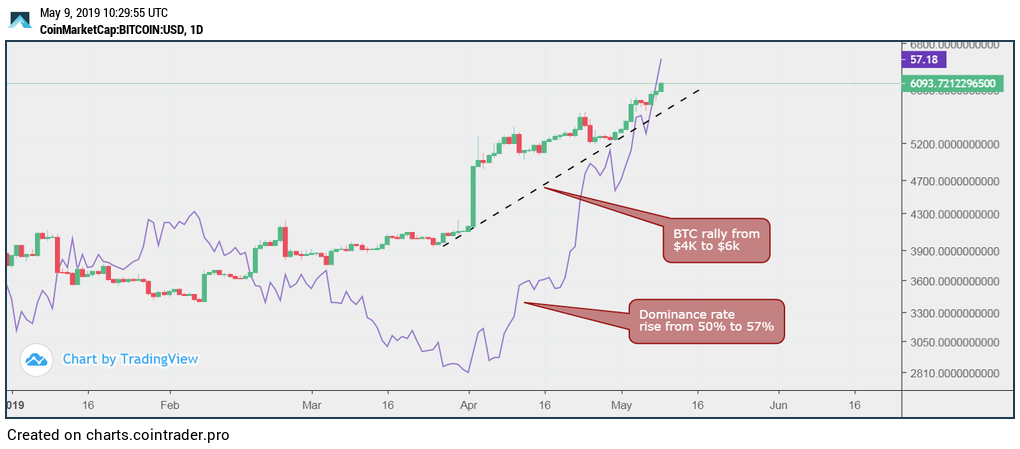
Meanwhile, BTC’s dominance rate, which tracks its percentage of the total cryptocurrency market capitalization, has also jumped to 57.14 percent, the highest for eight months, according to CoinMarketCap.
A rising dominance rate essentially means the demand for bitcoin is greater than the demand for alternative cryptocurrencies (altcoins) and suggests that investors are buying bitcoins for the long haul and not merely to fund altcoin purchases (which often can’t be bought with fiat).
Bitcoin price/dominance rate comparison (2019)
Bitcoin’s near 50 percent price rally from its April 1 low near $4,000 is accompanied by a rise in the dominance rate from 50 percent to the current 57.14 percent.
That essentially means the alternative cryptocurrencies have partly decoupled from BTC as investors buy to hold.
This is evident from the fact that the BTC-denominated exchange rates of major altcoins like XRP, cardano (ADA), tron (TRX), dash (DASH), NEO (NEO), zcash (ZEC) and others have hit 2019 lows this week.
Had the dominance rate stayed put, the recent rally could have qualified as a speculative bubble, i.e. investors rotating money out of BTC and into cheap altcoins in a bid to make a quick profit.
Such price gains are often short-lived, as seen in the chart below.
Bitcoin price/dominance rate comparison (April–May 2018)
BTC rallied from lows near $6,500 in early April 2018 to $10,000 by early March. During the same time frame, its dominance rate dropped from 45 to 35 percent. That divergence did not bode well for the price, which ended up falling to $5,800 by the end of June. Other corrective rallies seen in 2018 also lacked support from the dominance rate.
Bitcoin price/dominance rate comparison (2017)
A flow toward bitcoin is usually seen at the start of the bull run, as seen in the chart above. For instance, the dominance rate rose from 38 percent to 66.5 percent in the second half of 2017 when prices went from $1,700 to $20,000.
As a result, the recent rise in the dominance rate could be considered a confirmation of a new bull market. A number of technical studies have also echoed similar sentiments over the last few weeks.
BTC, therefore, could extend the rally toward $6,544 (Nov. 7 high), although a temporary pullback cannot be ruled out if the immediate resistance band of $6,055–$6,100 proves a tough nut to crack in the next day or two.
Daily chart
The above chart shows, BTC closed above the June 2018 low of $5,780 on Wednesday, invalidating the bearish candle created on a preceding day and establishing another bullish higher high above $6,000.
As of writing, however, the cryptocurrency is struggling to beat the resistance band of $6,055–$6,100. The cryptocurrency had clocked multiple daily lows in that range in September and October 2018. A break higher would further strengthen the bullish case, opening doors to $6,500.
Repeated failure at that resistance zone would validate an overbought reading on the relative strength index and allow a pullback to the ascending 10-day moving average (MA), currently at $5,633.
The bullish case would further weaken if prices find acceptance below the 30-day MA, currently at $5,365. However, the average has consistently reversed pullbacks since March and may hold ground again, given the long duration charts are biased bullish.
Disclosure: The author holds no cryptocurrency assets at the time of writing.
Bitcoin image via Shutterstock; charts by Trading View
Source: CoinDesk
 View
View


