

With the rapid expansion of wind energy production in Australia, the accurate assessment of wind resource variability has become of interest to project proponents and market stakeholders, with fluctuations in the availability of wind resources impacting many aspects of project development and operation, along with energy market value and system reliability.
As the significance of wind resource variability increases, synoptic scale (or large-scale) weather patterns are of interest, capturing the movement of high and low pressure systems ranging in size from several hundred, to several thousand, kilometres.
While the features of synoptic scale weather patterns inform day-to-day variability in wind speed, however, the link between synoptic scale patterns and energy market value is not widely considered by investors due to the complexity and high dimensionality of combined meteorological and power market analysis.
In our recent White Paper, we measure the recurrence of synoptic scale wind regimes across south eastern Australia, specifically South Australia, Victoria and southern New South Wales, over a ten-year period from 2008-2017.
In doing so, we introduce our advanced analytics model, EnerRISK, which applies advanced data science techniques to classify different synoptic scale weather systems and measure variation in the market value of wind production, both geographically (spatially) and over time (temporally).
Key Findings
A set of six wind resource clusters is identified across south eastern Australia, reflecting a range of recurring weather patterns. Each cluster is therefore characterised by a distinct synoptic scale pattern and wind profile.
Analysis provides insights into the ‘when?’ and ‘how often?’ different clusters recur. For example, in summer (days 0-60 and 335-365 in Figure 3), we see Clusters 2 and 3 are prominent in hotter months early and late in the calendar year, while Clusters 4, 6 and (to a lesser extent) 1 are prominent over winter (the middle band in Figure 3). The days of Cluster 5 generally fall in the shoulder seasons spring and autumn. Notably, while the extremes of winter and summer capture defined weather types, autumn and spring are shown to be more variable, with a greater mix of synoptic clusters reflecting the transition of weather types over the shoulder seasons.

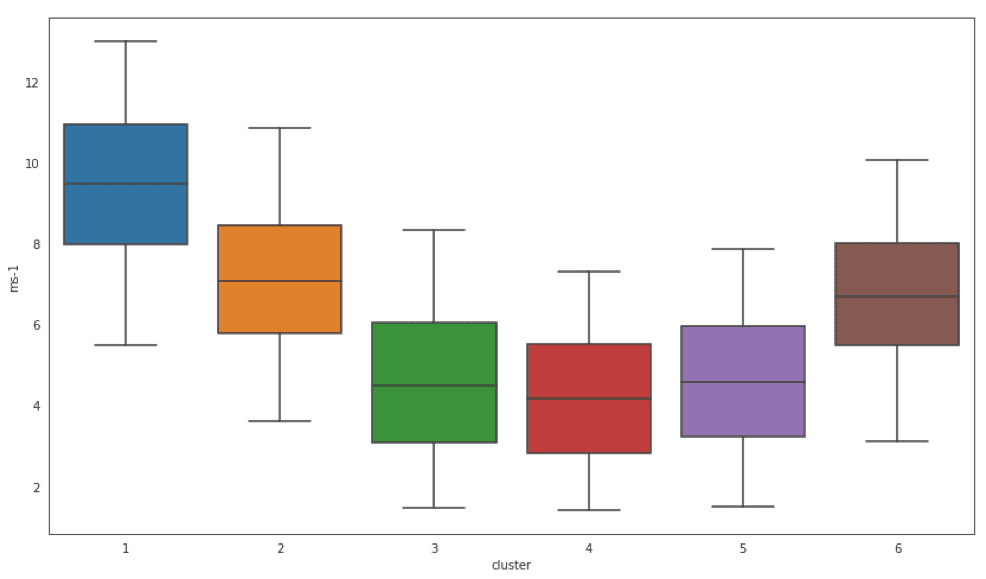
Across the six identified clusters we also see large variation in resource potential based on the average wind speed of each cluster, and smaller, but still significant, changes between single sites within a single cluster.
As shown in Figure 5, Clusters 1, 2 and 6 represent the strongest wind resources and can be considered the ‘windy’ clusters with average winds speeds at about half of the rated capacity of wind turbines. Comparably, clusters 3, 4 and 5 represent the weakest wind resources and can be considered ‘still’ clusters with average wind speeds at the bottom range of modern wind turbine production.
While other effects are not considered, patterns are evident when regional pool prices are grouped by synoptic type, reflecting the variation of cluster frequency seen in Figure 3. In addition, the characteristics of individual weather patterns and wind infeed into the spot market can be seen.
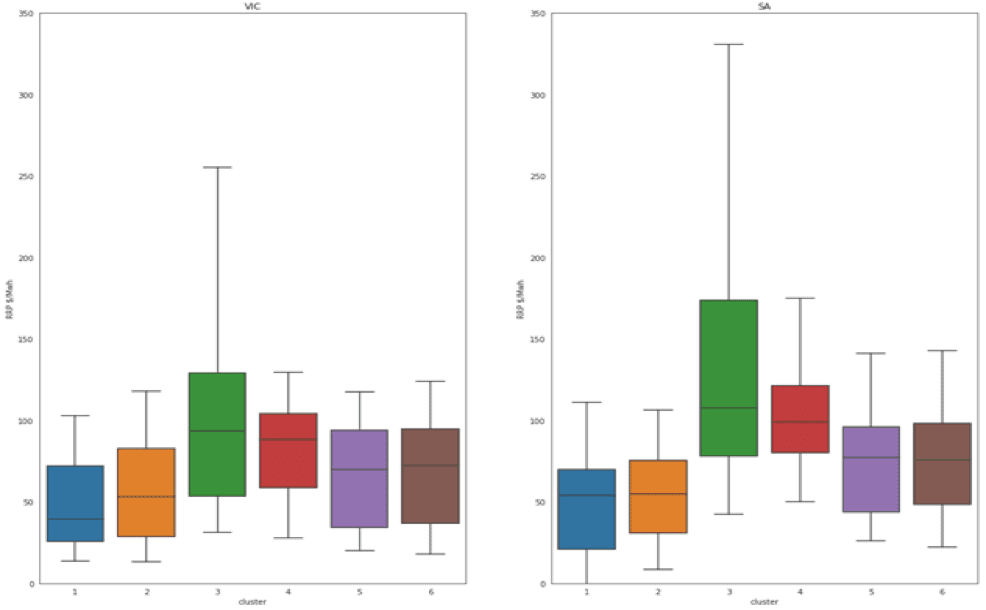
Windy Clusters 1 (blue) and 2 (orange-yellow), reflecting winter and summer storm patterns, respectively are shown to capture the lowest prices in the South Australian and Victorian markets, pushing into negative prices, particularly in South Australia, as most wind capacity operates near its rated capacity, while offering their energy at very low or negative prices. Comparably, in times of low wind generation (Clusters 3 and 4 in green and red, respectively), spot prices are shown to be generally higher to support the availability higher-cost generators.
Cluster 3 has the widest spread of prices, reflecting the hottest deep summer weather pattern when high electricity demand can stress electricity supply and result in extreme pricing. The highest prices are shown to occur in mid- to late-summer toward the end of a sustained series of hot Cluster 3 weather (sometimes followed by a single high wind stormy day during in which prices are noticeably depressed).
Key considerations for investors
Analysing wind resource variability within a clustering framework such as the one described here provides a more direct link between site-level wind production and synoptic scale meteorological patterns, informing the factors driving weak and strong wind periods on a seasonal gradation, which is more complex than more easily defined annual and diurnal cycles.
In combining key aspects of meteorological data science and electricity market simulation software, this type of analysis represents a key step towards more sophisticated investment and risk management decisions across many aspects of project development and operation, helping banks, project developers and asset managers to better understand more complex seasonal and inter-annual site-level wind energy variability.
Access the full White Paper
This article is derived from RepuTex’s recent White Paper, “Introduction to EnerRISK – Applying Data Science to Inform Wind Resource Variability and Spot Market Value”. To access the full White Paper, please click here.
Source: RenewEconomy
")
")
")
")
")